Join 9 other subscribers
Category Archives: Fractal Patterns
Is The Market Frustrating You…Well That’s A Good Thing
Posted by on March 7, 2011
 When the market starts frustrating you its doing its job….that is a “good thing” as its determining the next move…new push higher or test of major support…In the next two videos I give my perspective of what levels I am watching across several different assets to help understand and listen to what the market is preaching
…the 1st video I give brief explanation of my style and indicators that I use you can skip this video
Market Outlook
I breakdown currencies bonds commodities ETFs
………………..finish up with levels to watch in the indices
Market Breakdown
Posted by on March 8, 2010
Dollar/Gold/Crude/Nat Gas
DX(dollar)last week notes were neutral, but this week the pattern is setting up bearish with a break of 20day average, EUR/USD trading in a very tight consolidation and it is setup for a bullish move, the weekly dollar chart is rolling over and their are bearish signals in the Jerk and squeeze =bearish, GLD I was neural last week,I notice that the rallies are very weak, this week more of the same no direction, the jerk is close to going bearish =neutral, Crude last week notes mention bullish sideways consolidation forming, because of this consolidation holding up and the crossover of the 20 &50day moving averages, pattern setting to break the 6 month channel =bullish, Nat Gas FCG is 6 month channel with no define direction, need to see a define break over 19.00 to change pattern to bullish =neutral


Banking
the XLF has been on fire I post a trade setup on Feb 2 for the XLF to brake the 6 month channel, the pattern is still bullish, but last week notes I stated some weakness in the pattern coming in 2 weeks, I am becoming more cautious here as the the Jerk is showing some weakness in price at this level, the sell off is still setting up for next week, I will update the pattern this week if the pattern breaks down =bullish

Tech
the QQQQ the last two weeks was given a tell of a bullish move in the market, the indicators are bullish, Q’s pattern is setting to test resistance =bullish, the SMH is not looking so sexy, indicators are point to a bearish move in the semis, even with rally last week the semis looked tired =neutral


Materials/Transport
XLB last week notes were bearish, wrong! materials rallied with no dollar weakness that is very interesting, this could be a tell or a change in how materials and the dollar trade, a break
of the 0 line on the Jerk would make this a real bullish pattern =neutral, IYT in last week notes I stated a brake of the 0 line would setup a new 52 week high, this week the bullish move continues, their is weakness setting up in price on the daily Jerk indicator, but the weekly is still bullish =bullish,,,,I posted the daily and weekly charts


Bonds
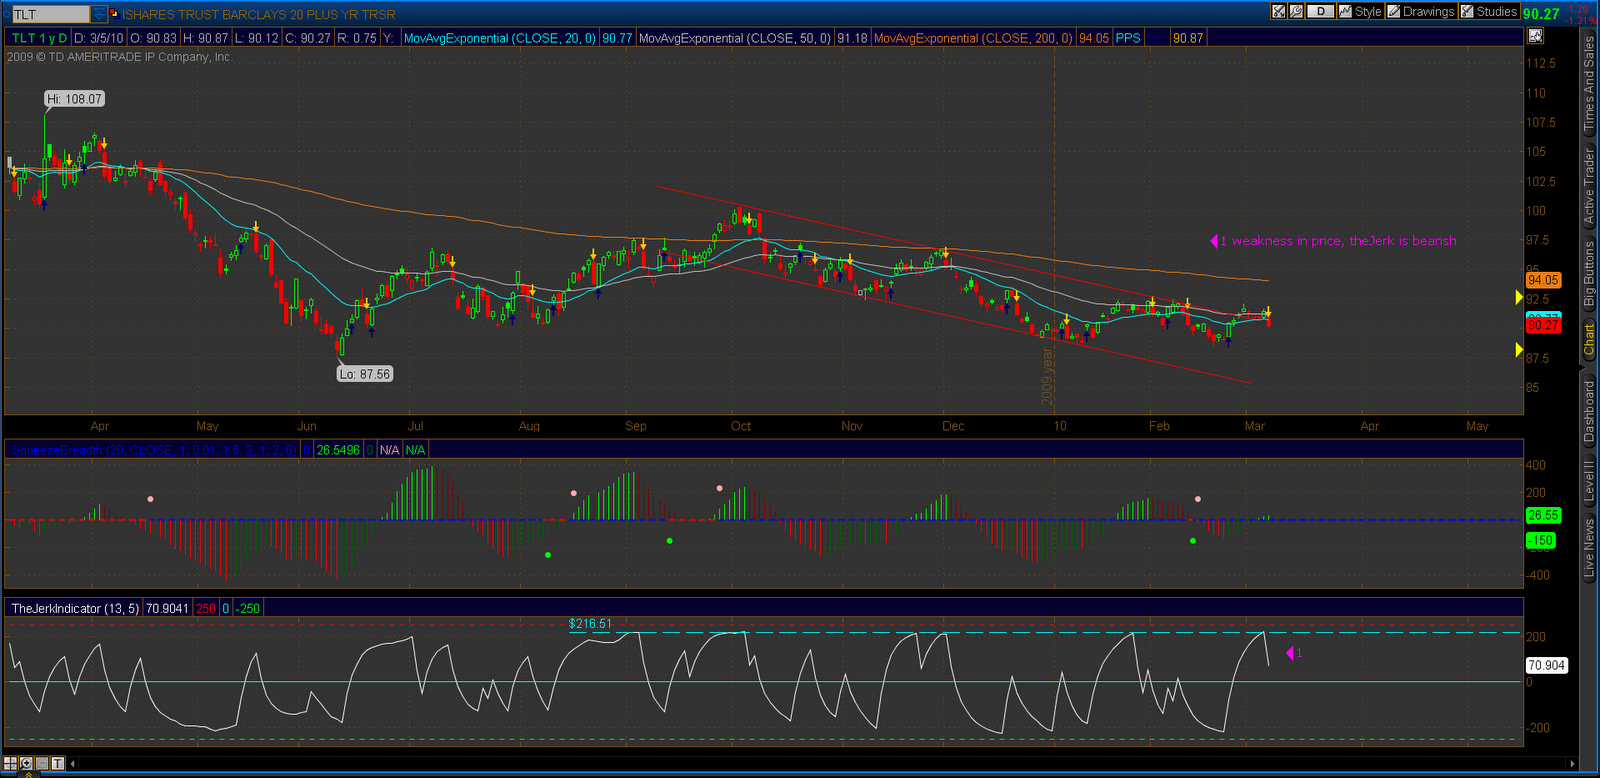
JNK(high yield) was bullish last week, the pattern and indicators are setting up to retest the high made in January =bullish, TLT last week was neutral, it traded in a sideways bearish pattern all week, this week the Jerk is showing weakness in price =bearish

Foreign Markets(China)
GXC trade out of its sideways consolidation last week, last week notes stated need to brake out of the choppiness in price and that happen on Friday, the weekly squeeze and Jerk are both bullish setups in the pattern =bullish, the Shanghai is setting on its 200day with the 50day move average as resistance, the pattern is setting up for a bullish move above its 50day =bullish

Market
the patterns are becoming a little extend your starting to see signs of weakness in price the XLF and IYT, also the QQQQ looking a little heavy with resistance close, In the overall market I still see a move to the upside base the weakness in the dollar which should move crude related stocks, but need to pay attention to the the VIX closing in on a to 2 year low, the fractal pattern on SPX is still bullish, this week I am more cautiously bullish and if more price weakness starts setting up,,,,taking more profits off the table

Market Breakdown
Posted by on March 1, 2010
Dollar/Gold/Crude/Nat Gas
with all the moving averages under DX(dollar) given it support and the EUR/USD for a month holding support 1.368 and NO buy signal on the Jerk, absolute no trade here same as last week =neutral, last week notes in GLD charts was showing bullish activity, this week little less bullish and more sideways action in the pattern = neutral, last week in crude the pattern was setting up bullish, what happen last week was sideways consolidation, but the the Jerk is showing price strength in the sideways consolidation, the pattern is showing a brake above the 5 month channel(83.00), but the sideways action looks to continue this week =neutral, FCG(nat gas) is in a 6 month channel, no major weakness in price, last week notes was bullish and the pattern trade sideways, need to see a define brake over 19.00 to change pattern to bullish =neutral


Banking
XLF is still sitting on 20 &50day support, the pattern still showing a bullish move to the top of the channel, but the the Jerk is showing weakness in price is coming in the next 2 weeks, the underline stocks in this ETF are showing same pattern =bullish

Tech
the notes form last week was showing a bullish move in the pattern
and that bullish pattern continues this week, if you listen to the noise you would have been chopped up last week in the Q’s, but the pattern had a different tell this tight bullish channel and a bullish price strength formed in the the Jerk last week, the pattern is forming a move to a retest of the Jan 10 high in the weekly chart =bullish

Materials/Transports
in the XLB last week notes stated that resistance was at 32.63 the XLB hit 32.58 and sold off, a failure to brake resistance and a bearish channel setting up with the 20 &50day above as resistance to any rally =bearish, the IYT bullish pattern setup last week is bullish this week resistance is still at 75.68, define brake of resistance and the weekly Jerk brake of 0 line would setup for a new 52 week high =bullish

Bonds
JNK(high yield) last week bullish pattern is bullish this week, on the weekly chart the 20day under for support and the bounce in the Jerk is setting up for a bullish to the 200day moving average, TLT, the notes and the pattern were completely wrong last week, the TLT broke out of the falling wedge pattern, the Jerk and the squeeze is showing a bullish move this week, but I don’t see strength in the bullish move =neutral


Foreign Markets
GXC is still in a sideways pattern with resistance at 69.33 s define brake of resistance and less choppiness in the Jerk would move to a bullish pattern =neutral, the Shanghai broke above its 200day, a define brake of resistance 3145.09 bullish move in the pattern =neutral —-I only look at China’s market, really only one that matters for right now!

Market
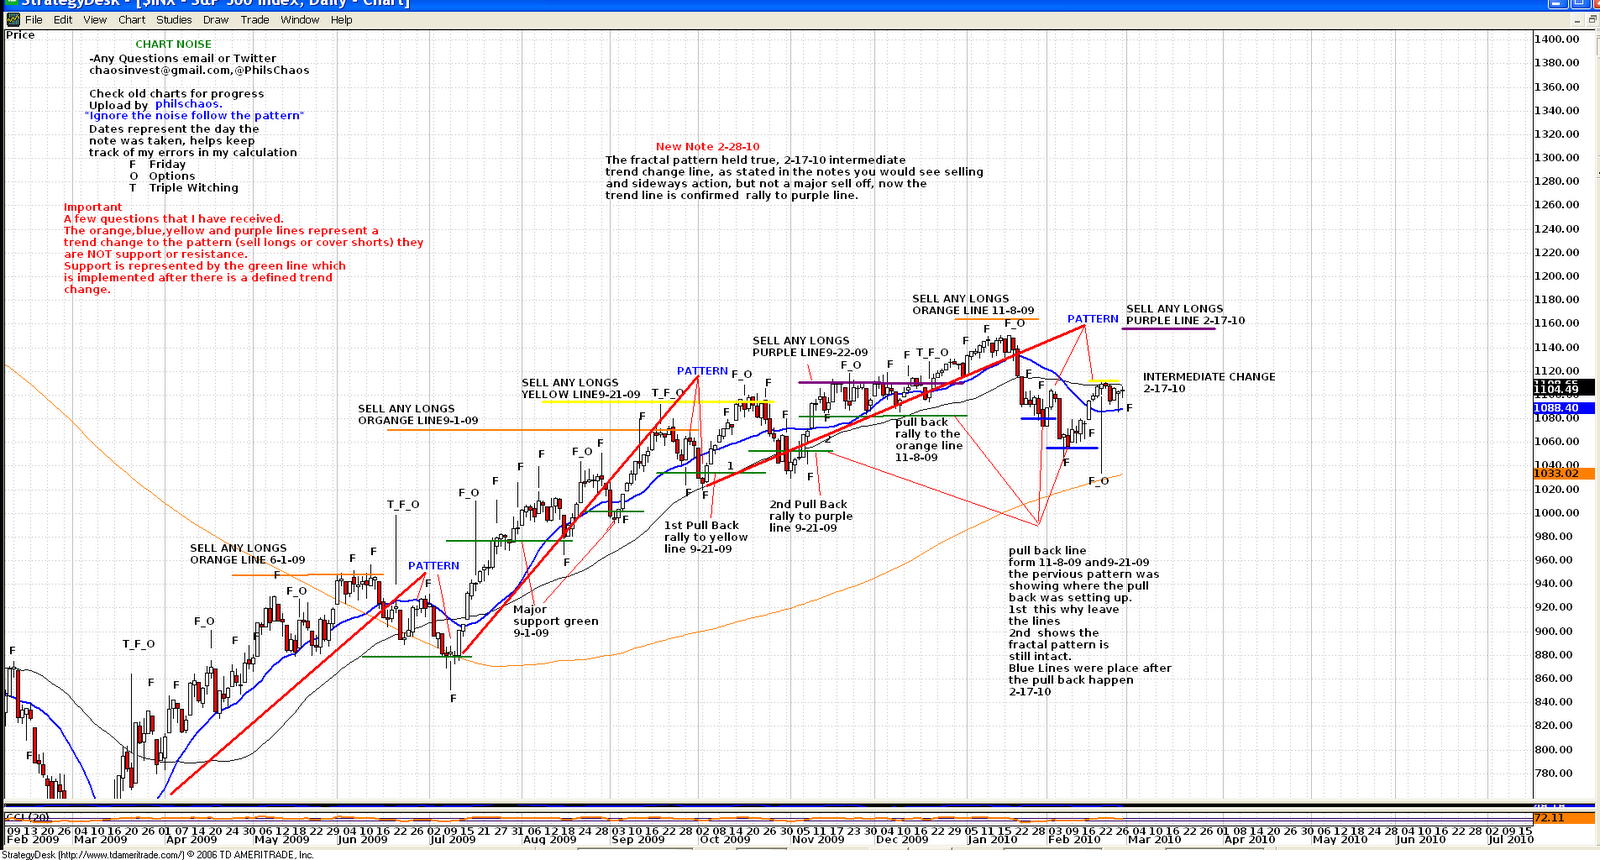
there was a lot of bullish patterns setting up last week, its was given a tell that the sell off showing up in the fractal pattern SPX( look at chart below) was only intermediate trend change. one of ETF that was a tell of market strength is the IYT which had a bullish pattern last week and continues to setup bullish this week, the noise in Tech (Q’s)would have chopped you up last week, but last weeks pattern was showing bullish price strength, the Q’s are going to do some bullish damage this week,,,,, the traders like there junk bonds-high yield-, this is positive for the overall market, I could not be more wrong in the TLT pattern last week ,,,,the dollar is “sitting in limbo waiting for the tide to turn” this causing the XLB bearishness and gold and crude to trade sideways, I am seen little more bullish pattern in crude,still neutral, the following week maybe the bullish rally,,,,,,
For the market pattern in SPX =bullish
the notes on 2-17-10 and 2-28-10 SPX fractal pattern